Context
Cardify was the public-facing thought leadership arm of Drop, a B2B alternative data business with $40B in annual transaction volume across 198,000 anonymized consumers. The data was sold to hedge funds and institutional buyers, but the reports were how we earned attention.
I joined to manage the website and design. By the time I left, I was running the whole publication: writing reports, designing every layer of the funnel, and building the operational pipeline that let a small team produce flagship work at the cadence of a much larger one.
The Thesis
Cardify wasn’t really a content product. It was a B2B funnel disguised as a publication.
The reports earned attention. The newsletter captured intent. The lead capture converted readers into prospects for Drop’s institutional data business. And the automation pipeline made the whole loop sustainable for a lean team.
My job was designing every layer.
| Layer | What it was | How it worked |
|---|---|---|
| Content | Original research using Drop's transaction panel | Reports analyzing market shifts (Peloton, crypto, BNPL, QSR) using data competitors didn't have |
| PR | Earned media placement of the reports | Reports designed to be citable, screenshot-able, and shareable across financial press |
| Newsletter | Capture layer for readers earned through PR | ~2,500 high-signal subscribers including the Fed, McKinsey, BNPL platforms, hedge funds |
| Data Product | Conversion to Drop's institutional dataset | Product pages mapping public reports to underlying data licenses |
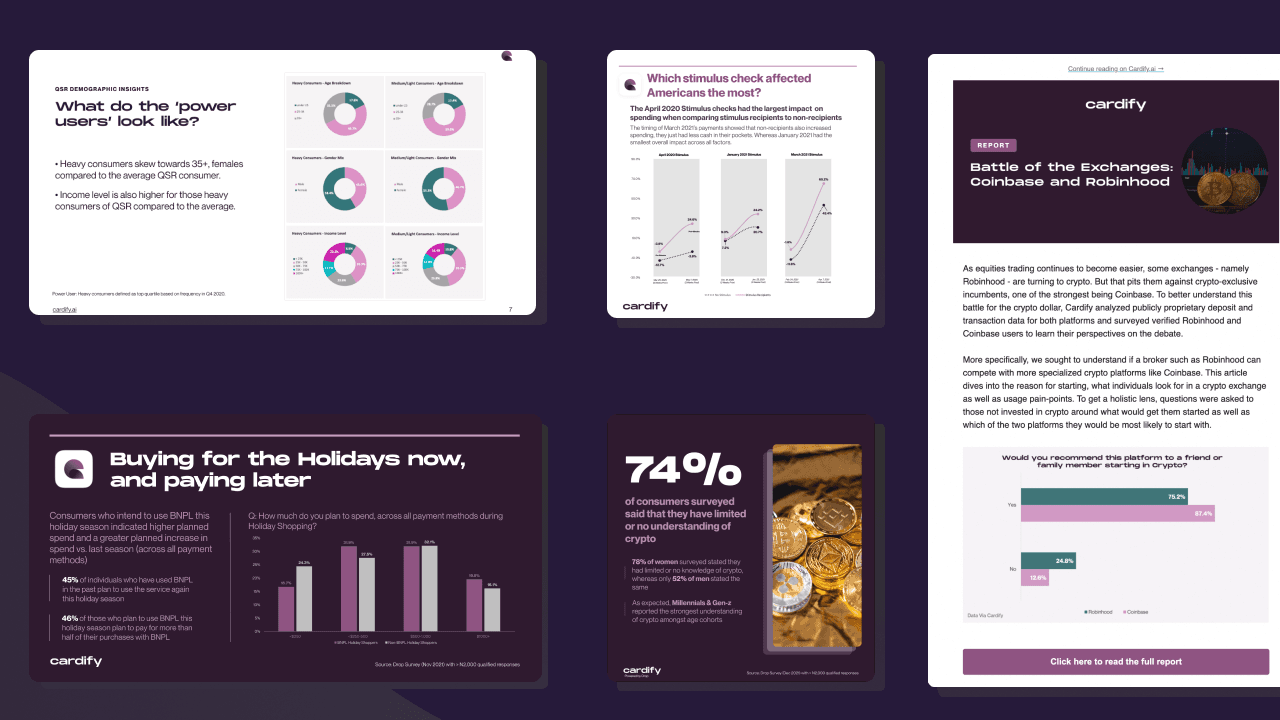
Layer 1: Reports Designed to Travel
The reports did two jobs at once, and the relationship between them was the whole product. Public-facing journalism earned citations from press and broadcast media. Those citations drove newsletter signups from institutional buyers. The newsletter became the qualification layer for Drop’s data business. The journalism wasn’t separate from the data sales. It was the top of the data sales funnel.
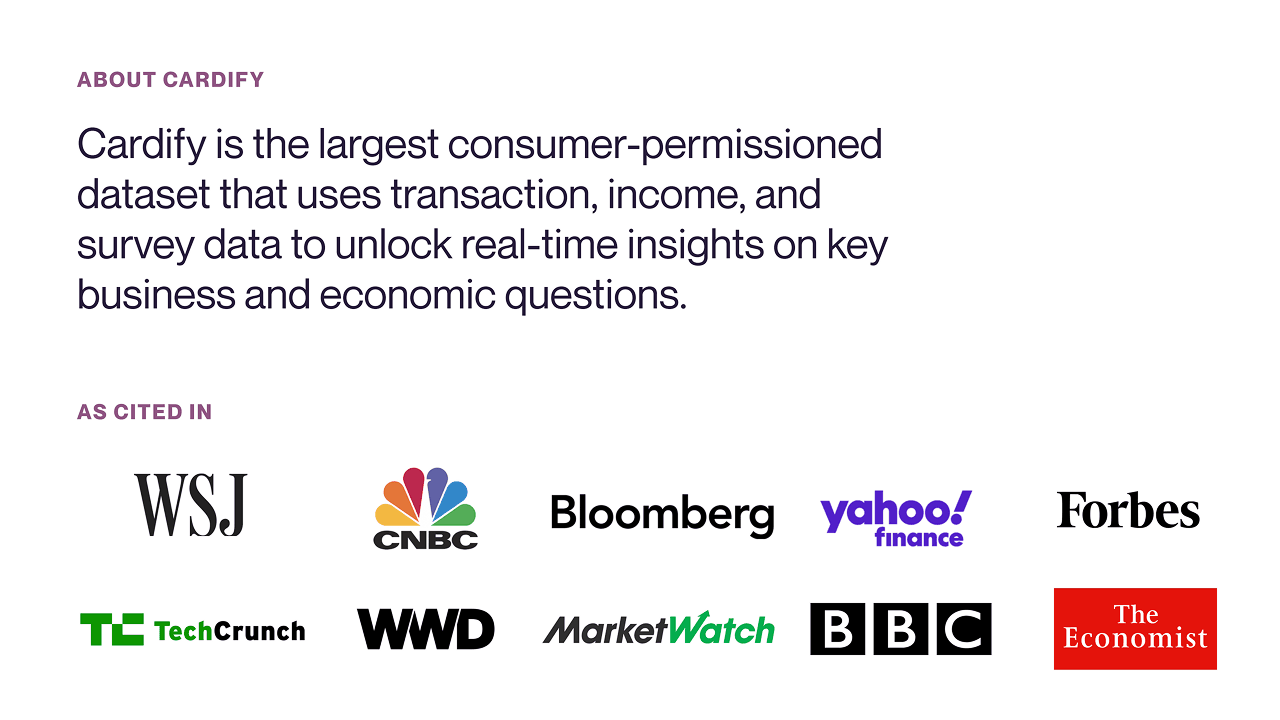
Over two years, the reports were cited across ten+ major outlets, including WSJ, Bloomberg, The Economist, BBC, CNBC, MarketWatch, Yahoo Finance, Fox Business, and WWD.
One of the reports I led, All Aboard the Crypto Train: Who Are the Latest Crypto Investors? (February 2021), was later cited by ECB Executive Board member Fabio Panetta in an April 2022 speech at Columbia University on cryptocurrency regulation, alongside research from the IMF, the Financial Stability Board, and the OECD.
The design work was about making the data portable: charts that read in three seconds, takeaways that functioned as quotes, reports that gave journalists on any beat something they could pull and use.
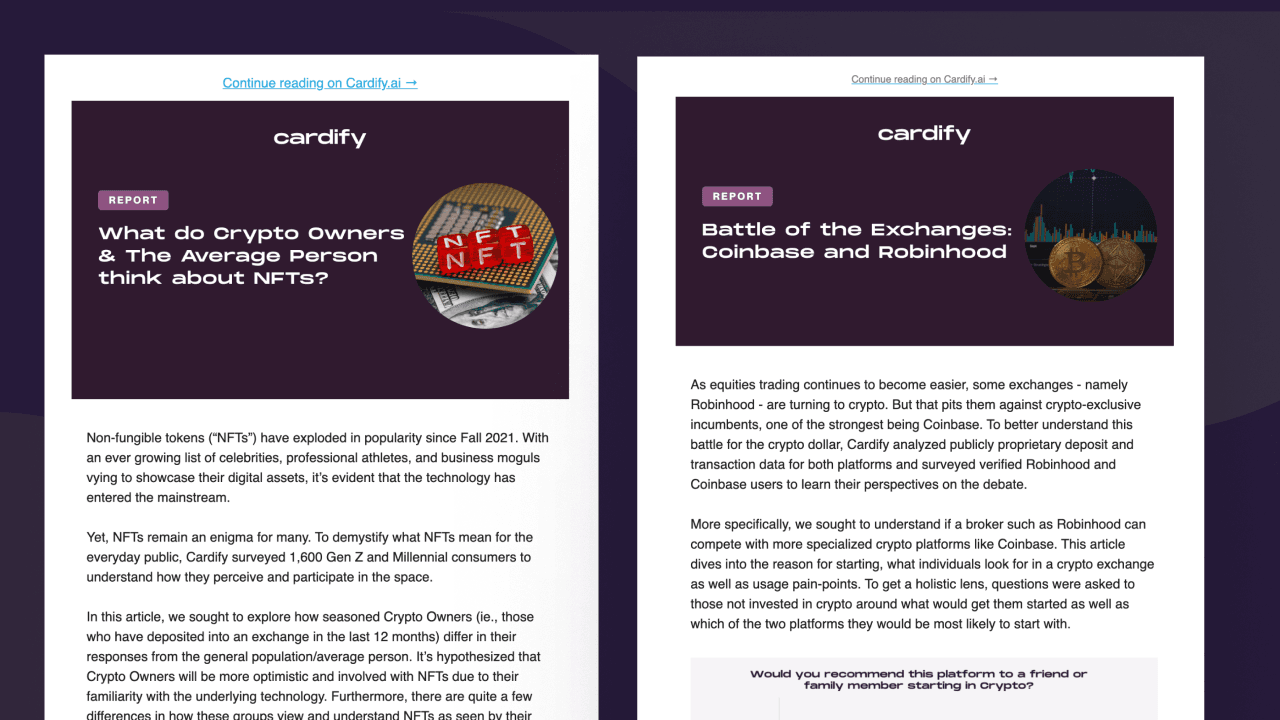
Layer 2: A Small, High-Signal Newsletter
The reports earned attention; the newsletter captured it.
The list grew to ~2,500 subscribers, but the names mattered more than the count. Subscribers included decision-makers at the Fed, McKinsey, major BNPL platforms, hedge funds, and the consumer packaged goods buyers who shaped Drop’s institutional pipeline.
In B2B alternative data, distribution quality compounds. A single subscriber from the right firm could be worth more than ten thousand from the wrong ones.
The newsletter design was tuned for that audience: data-forward, low-fluff, and built to surface premium content behind a soft paywall that invited rather than blocked.
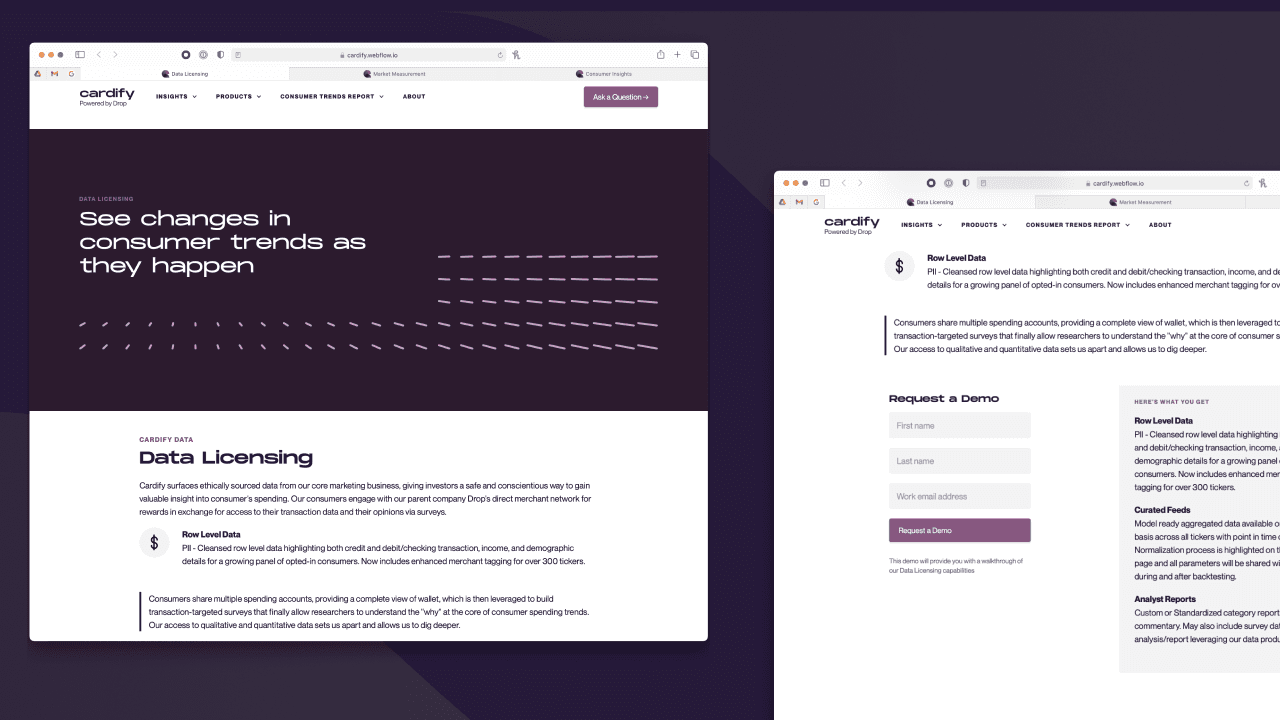
Layer 3: The Conversion Path
When a reader hit the soft paywall or hit the data-product pages on the site, the design had to translate reader interest into qualified institutional lead.
I built product pages for each of Drop’s data arms, designed to map the public-facing reports to the underlying datasets a buyer could license. The articles became case studies for the data. The reports became sales collateral without ever feeling like sales collateral.
The institutional pipeline pulled in serious buyers. By late 2020, Cardify data was being licensed by Goldman Sachs and the Wall Street Journal, and Snowflake was featuring the dataset in customer demos.
Layer 4: The Pipeline
A funnel doesn’t compound if you can’t sustain it. When I started, weekly reports took ~7 days to produce. Every chart designed from scratch, every distribution involving manual handoffs across SQL, Excel, Figma, Chart.js, Webflow, and Mailchimp. I built templates and automations across the stack: Figma component libraries for the chart system, Excel macros pulling directly from SQL, Webflow CMS structures for distribution, Zapier workflows connecting the pieces. Lead time dropped to under 1 day. Team capacity for content roughly doubled.
What This Taught Me
I learned that data is only as good as how legible it is to the reader. The clearest signal in the world doesn’t travel if the chart is confusing or the framing buries the lede. And a content product, no matter how good, is a hobby unless every layer of the funnel underneath it is designed with intent.
That instinct shows up in everything I’ve done since. The qualification form case study is the same idea applied to trust. The search system case study is the same idea applied to query parsing. Make the thing the user is doing legible to them, and design every layer of the funnel that surrounds it.
I just learned it first by trying to make a transaction database legible enough to make Bloomberg.